
How mobile LiDAR data delivers better outcomes at Olympic Dam
A case study showing how new technology has encouraged collaboration across technical teams at Olympic Dam, led to the development of efficient workflows and brought increased safety benefits
Introduction
BHP’s Olympic Dam (OD) mine was an early adopter of Emesent’s Hovermap mobile LiDAR system. First deployed in February 2019, Hovermap is now integral to the mine’s underground operational workflows. Geotech, engineering, geology and survey teams use data captured by Hovermap from stopes, orepasses, drawpoints and other underground infrastructure.
This case study highlights OD’s commitment to using emerging technology to improve data capture in inaccessible areas, and outlines the safety and efficiency benefits of doing so.
Background
Emesent has an ongoing relationship with the various technical services departments at OD. It runs Hovermap operator training courses and teaches technical teams to use the Emesent proprietary data processing software. Emesent designers have worked closely with BHP to create prototype accessories for vertical shaft scanning. OD’s technical teams provide feedback that is helping Emesent optimise Hovermap’s performance in harsh underground environments, and enhance the usability of the Emesent data processing solution.
Emesent and OD have published research papers on applications for autonomous drones in underground mining (eg Jones, Reardon and Hrabar, 2019). OD technical services specialists have presented at Emesent webinars (eg Jones, 2020a); at the East Australian Ground Control Group (eg Baylis and Kewe, 2020); at the Australian Centre of Geomechanics Underground Mining Technology Conference (eg Baylis, Kewe and Jones, 2020; Jones, 2020b), and most recently at the virtual MassMin2020 conference (eg Woolmer et al, 2021) in Chile. These papers have formed the basis for this case study.
The Olympic Dam mine
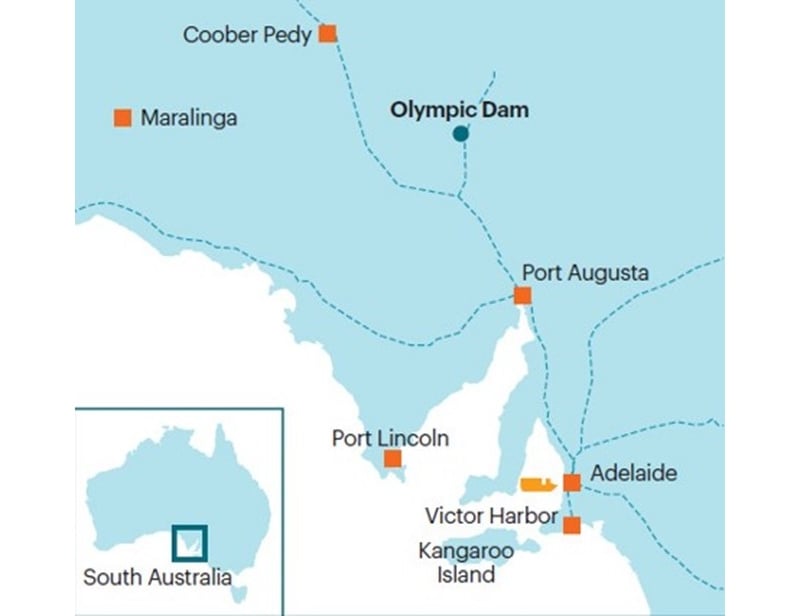
The Olympic Dam (OD) mine is located in central South Australia, approximately 560 km north-northwest of Adelaide (Figure 1). Production from the large polymetallic orebody commenced in 1988 when the site was owned by Western Mining Corporation. BHP Group Ltd acquired OD in 2005 and the site has since become one of the largest sublevel open stope mines in the world. In FY2020, OD produced 171,600 t of copper cathode, 146,000 oz of gold, 984,000 oz of silver and 3,678 t of uranium concentrate (BHP, 2020).
(Baylis, Kewe, & Jones, 2020).
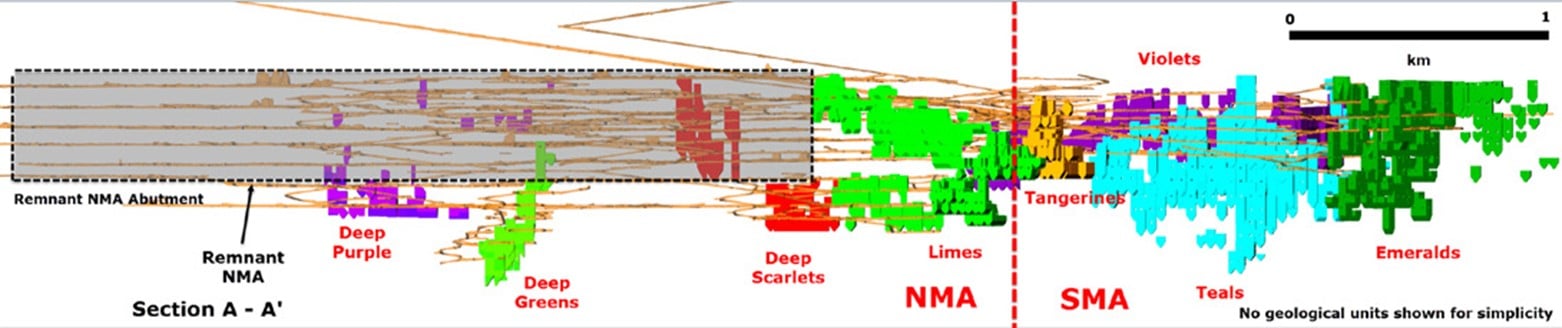
The mining operations extend 6 km along strike from north-west to south-east, 3 km north-east to south-west and to about 900 m in the deepest areas. For the past 30 years, mining has occurred in the Northern Mining Area (NMA). Future expansion is underway in deeper NMA areas and in the Southern Mining Area (SMA) (Figure 2).
Issues with Southern Mining Area
After 30 years of mining, the rock mass conditions of the NMA are well understood. Consistent stope designs and entrenched extraction methodologies have yielded consistently high outputs during that period. However, the expansion into the SMA has presented new challenges for BHP.
They include: new lithological units; higher degrees of alteration throughout the rock mass; and a broader influence of regional, deposit and lode-scale structures. Variance in rock mass parameters and spatial variability have created significant geotechnical uncertainty. Understanding the rock mass and stope performance has formed part of reducing this uncertainty and developing a successful mining plan for the SMA.
Sub-level open stoping at Olympic Dam
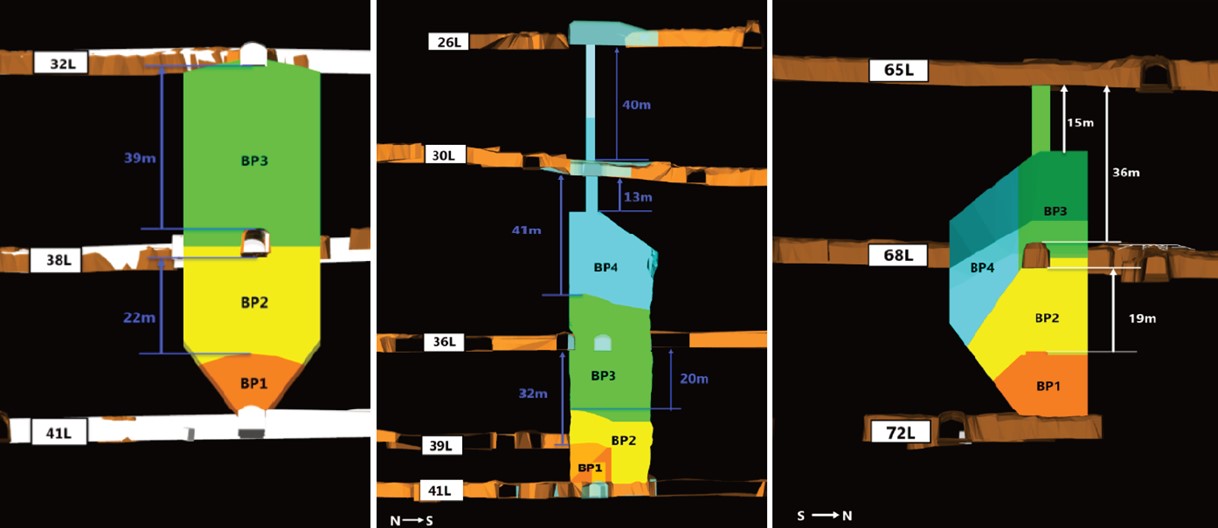
Stopes at OD vary widely in size – from single lift 30 m stopes to multi-lift stopes exceeding 200 m in height. They are aligned on a 30 × 30 m or 25 × 25 m grid footprint. Blasting typically occurs in two or more blast packets.
All stopes have at least two access points: at the drawpoint and the crown level (Figure 3). Larger stopes also have intermediate-level access points. OD turns over between 50 to 60 stopes each year.
Deployment of Hovermap
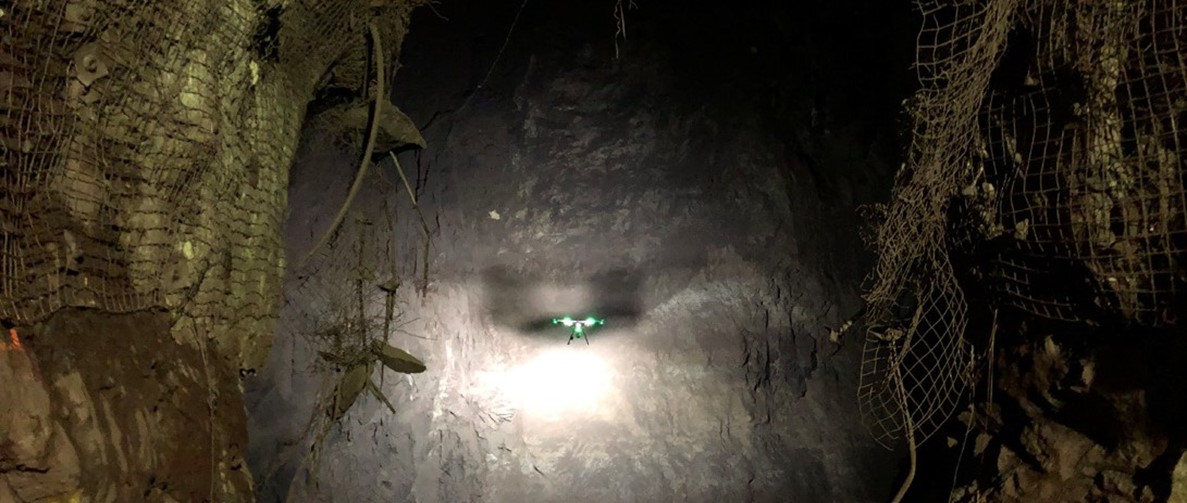
In February 2019, OD’s survey and production teams began using the Emesent Hovermap LiDAR scanning system to scan stopes (Figure 4). The technology replaced conventional Cavity Monitoring Systems (CMS).
Following the deployment of Emesent in the survey and production teams in 2019, the OD geotech team subsequently recognised that they too could use the LiDAR data to improve their understanding of the SMA rock mass characteristics, research failure mechanisms within stopes, and revaluate design assumptions through back-analysis.
Hovermap is now deployed nearly every day and the range of targets has expanded; the system is currently used to scan stopes, drives, orepasses, raises and retired infrastructure.
Workflow
OD has integrated mobile LiDAR scanning into its underground 8-day operational scheduling workflow (Figure 5). Engineers, surveyors and geologists identify the target and purpose of each scan and submit a scheduling request. This process ensures sites are prepared and hardware and operators are available.
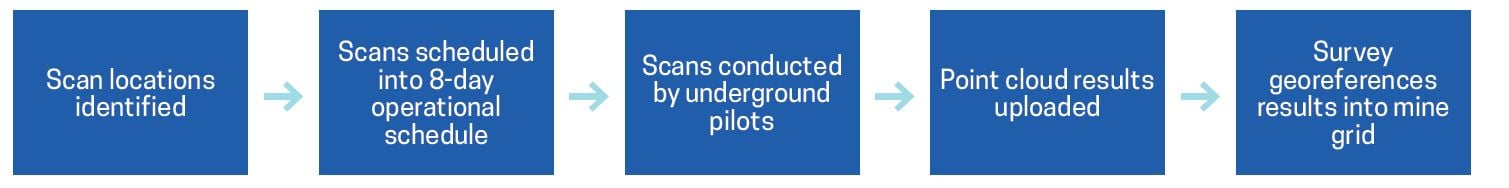
Multiple drone-based scans may be scheduled each day. Scan priorities vary and urgent scans may take precedence over scheduled production. Scans are performed by underground operators who have been trained to pilot the Hovermap system. Set-up and scanning take just 10 minutes.
Raw scan data is processed underground by the drone operators. This reduces processing time on the surface and enables the Hovermap scanner to remain underground. Each scan generates between 500 mb – 1 Gb of data. Two files, in .laz/.las format, are uploaded onto OD’s network for use on the surface: a full raw point cloud and a sub-sampled low-resolution point cloud.
Each scan delivers accurate, uniform density, high-resolution LiDAR point cloud data, without exposing personnel to the potential hazards associated with voids.
Data preparation
While it calls for higher processing capacity—LiDAR data sets are often 1 Gb or greater, and contain millions of points—working with point cloud data has significant advantages over the alternative, conventional wireframed meshes. Every Hovermap LiDAR point contains additional information beyond just position (X, Y, Z) in space, including time, range, reflectance intensity, return number (strongest and last) and ring number. These provide, at a minimum, greater flexibility in filtering, slicing and visualising point cloud data.
Prior to analysis, OD personnel perform a quality assurance/quality control (QA/QC) check of the scans for errors or shadows. The point clouds are then georeferenced to the mine’s coordinate system.
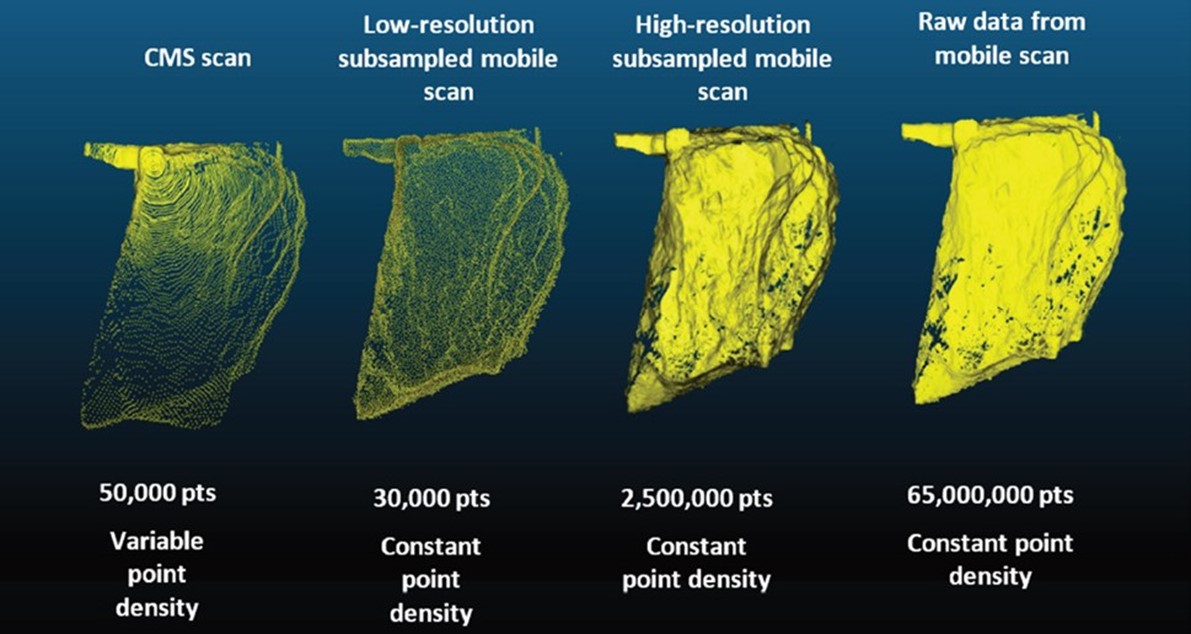
A full stope scan can generate between 40 – 120 million data points, depending on the void size and scan duration. However, most applications do not require the raw scan resolution. A low-resolution point cloud, subsampled at ~250 mm spaced (25 points per m2) data points, is produced for wireframing and volumetric overbreak and underbreak analysis in accordance with the conventional workflow for wireframing and visualisation. The results are stored in the mine’s Deswik.MDM database, so the engineering department can compare scans from different points in time. These subsampled point clouds have uniform point density compared with a CMS scan and typically produce a more accurate volumetric mesh.
OD’s geotech team uses the high-resolution point clouds to pick and analyse structural features in greater detail. Comparative images of different scan densities are shown in Figure 6.
Stope scanning
More than 250 stope scans have been completed since the Hovermap technology was introduced. As underground operators have become more proficient in flying the drone, and surface teams more accustomed to working with point cloud data, the number of scans conducted each week has increased.
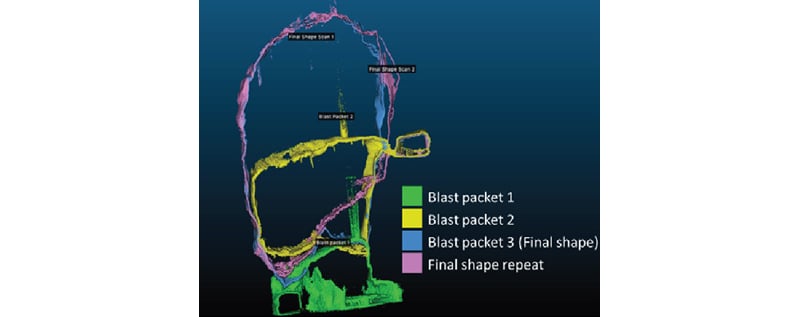
Scanning is now scheduled after almost every blast packet and at regular intervals throughout the lifecycle of each stope. This enables potential issues to be identified early and allows accurate measurement of in-stope stock volumes. Because each scan is georeferenced, merging scans can produce a progression of stope shapes and material extraction (Figure 7).
Kewe, 2020).
Data capture methods vary according to the stope conditions. If there is stock in a stope and access from the drawpoint is not possible, crown or mid-level drone-based scans are performed. Final stope scans are captured using Hovermap mounted to a teleremote loader, which is driven in and backed out. This method is quick and less risky than flying.
The geotech team uses point cloud data to conduct stope stability analysis. Overbreak and underbreak can be calculated, and final stope shape observed in Figure 8, at a higher resolution than was possible previously. Stoping operations are also able to utilise Hovermap for backfill monitoring.
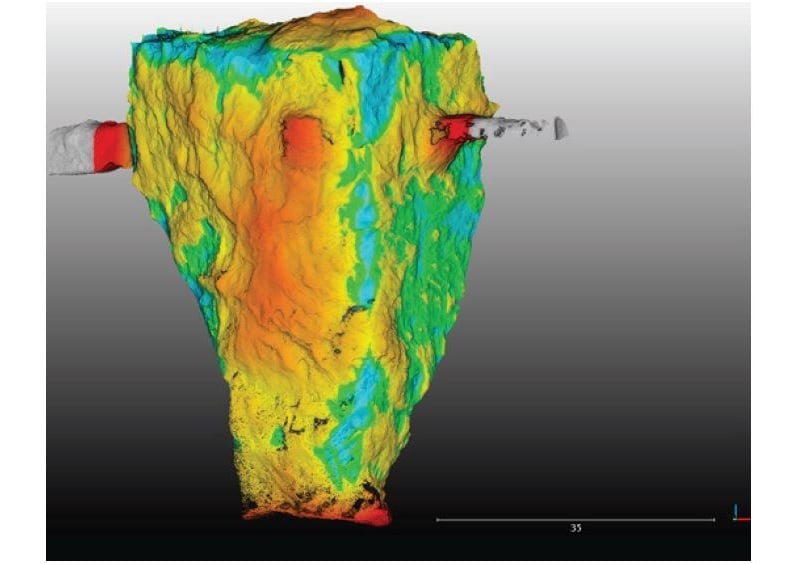
sets (Jones, 2020a).
Drawpoint inspection
Drawpoints are scanned by mounting Hovermap to a teleremote loader or drone. In rare instances, a walking scan is performed.
Figure 9 shows the point clouds from two drone-based scans, scheduled at intervals, to monitor stope drawpoint movement as a result of bogging. The original gray scan was merged with the red scan captured one week later. Even though the drone could not proceed past the drawpoint, enough points shot up into the stope to show the shape changes during this period.
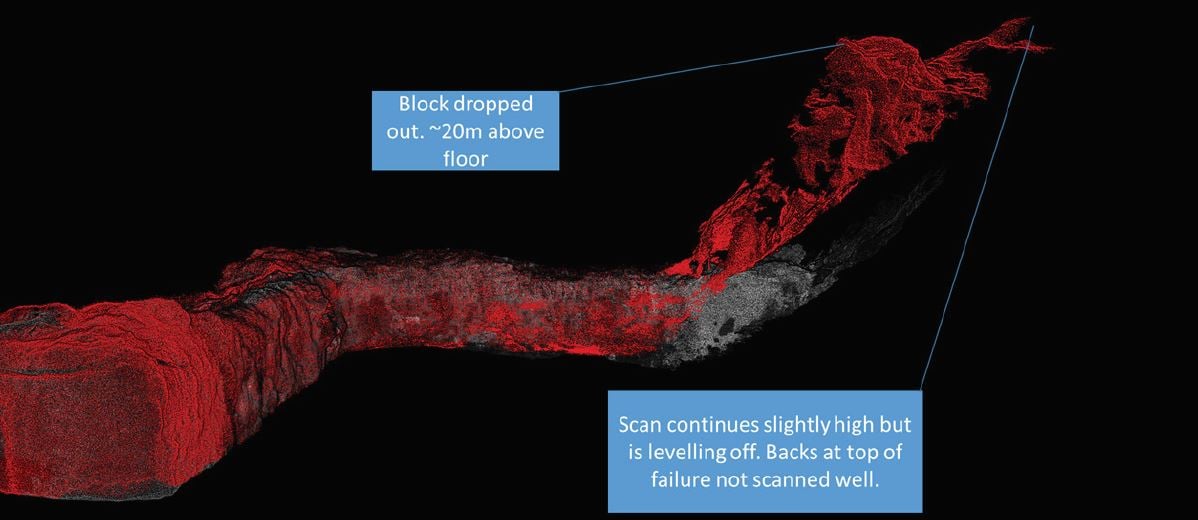
This exercise delivered 3D spatial data that allowed engineers to determine that the brow had receded rapidly and the drawpoint was obstructed by a large block dislodged from 20 m above the floor.
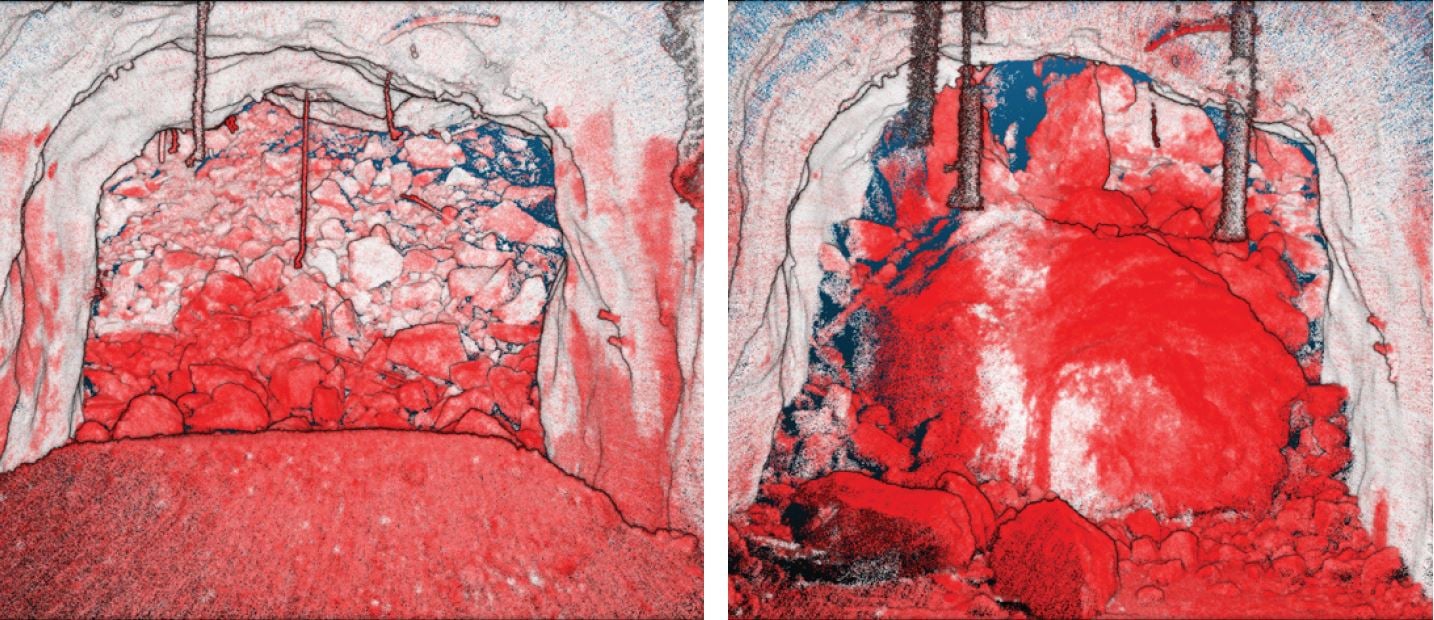
Figure 10 shows the point clouds for the above drawpoint, captured a week apart. They illustrate the value of scanning inaccessible areas with mobile LiDAR.
In the first scan (left), evenly fragmented material can be seen reporting to the drawpoint. The second scan (right), taken from the same location a week later, shows the brow has receded, the size of material reporting has increased, and a very large block has obstructed the drawpoint. This detailed intelligence enabled the engineering team to develop a plan to manage the drawpoint.
Orepass inspection
In the 1990s, prior to BHP’s ownership, Western Mining Corporation developed a haulage system to lift production from three million to nine million tonnes. The system sits on the southwestern side of the NMA and consists of 14 orepasses. These feed an automated rail haulage system that reports to the Clark shaft. Orepasses are 70 – 300 m in height and are fed from 52 fingerpasses. At the time of installation, LiDAR technology had not been developed. The first 3D image of the haulage system came in early 2000, when C-ALS borehole-deployable laser scanners were used.
To inform an analysis of potential hazards and risks associated with the infrastructure, Hovermap is now employed to scan the haulage system.
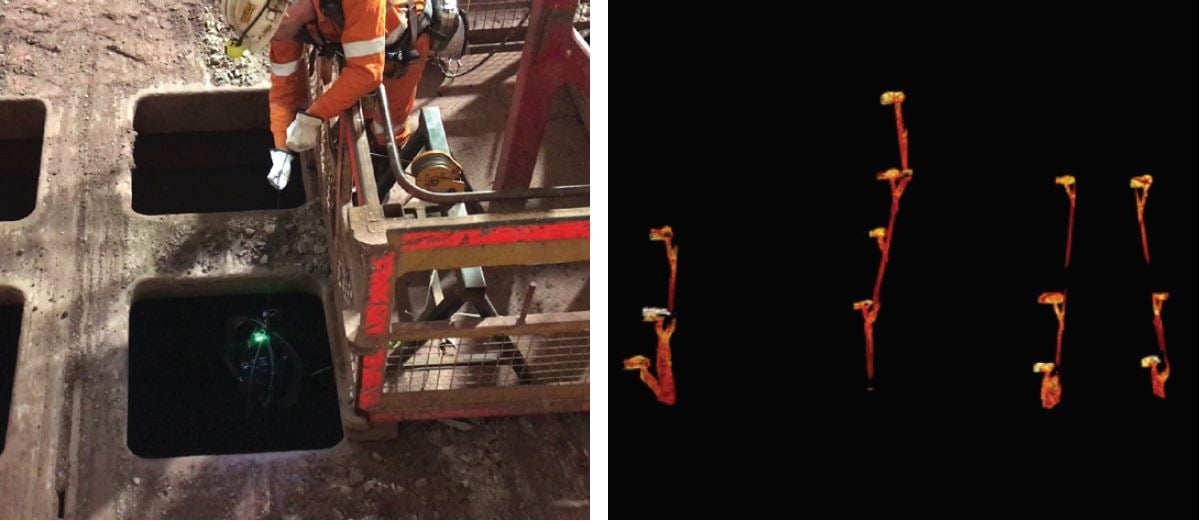
Grizzlies (800 x 800 mm) cover each fingerpass, so Hovermap is lowered in a protective cage from a winch.
In Figure 11, the LiDAR composite image (right) shows some of the scanned fingerpasses. OD now has high-resolution point clouds of the material handling system. These form a benchmark for ongoing analysis. Engineers can compare the old CAL scan shape and diameters to current dimensions, identify structural sets that may be controlling overbreak in areas of failure and determine how the passes are changing over time.
(Jones, 2020a).
Decommissioned infrastructure inspection
OD’s operating and decommissioned infrastructure is scanned to produce as-builts and to assess condition.
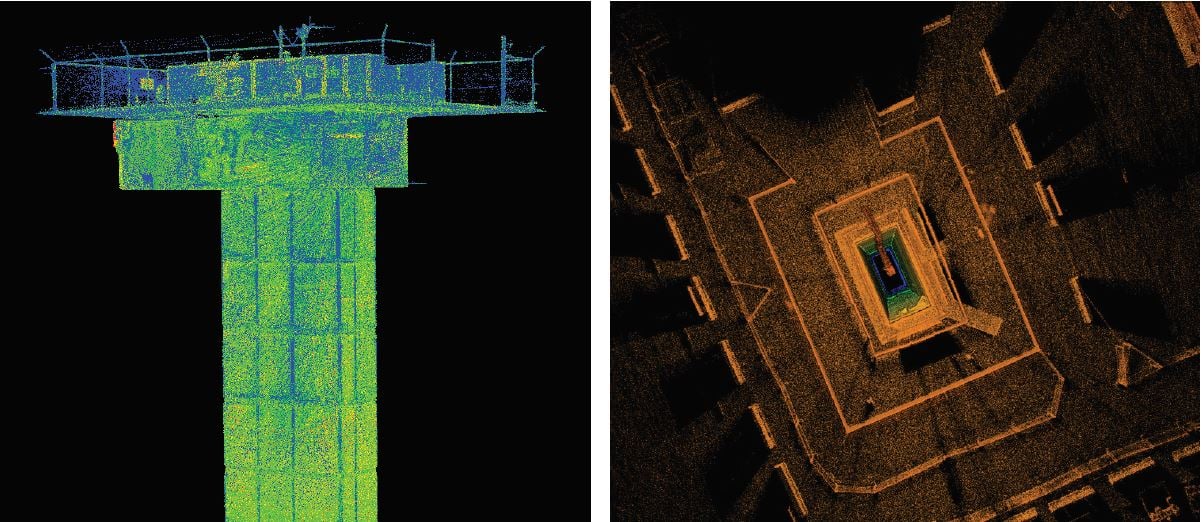
Figure 12 shows a decommissioned shaft that needs to be maintained to ensure its collar remains stable. To obtain LiDAR data, Hovermap was lowered 40 m from a crane winch. Data was processed and compared with a scan commissioned two years earlier. No significant movement, within the tolerances of the LiDAR of the prior scan, was detected.
Stope geotechnical analysis
At OD, analysis of a LiDAR stope scan for geology or geomechanics follows a workflow (Figure 13) that commences with importing a high-resolution georeferenced point cloud.
The geotech team uses this point cloud to identify visible planar facets resulting from geological features, such as joints, faults, shear zones, dykes and rock unit contacts. Stope-scale discontinuities are identified, wireframed and uploaded to mine databases. The geology team incorporates this data into their 3D structural model. The model informs underground stability forecasting and design parameters.
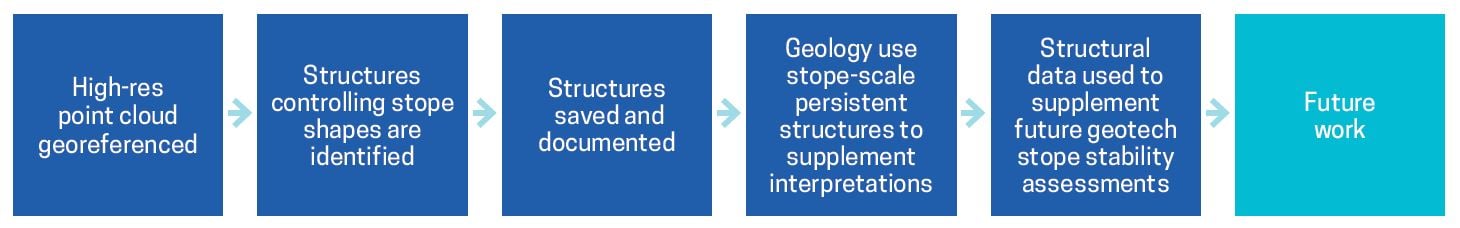
Next, smaller scale discontinuities, at least the width of a drive (~5 m), are identified in the crown and walls, as in the example shown in Figure 14. The additional detail regarding these structures contributes to a richer understanding of rock mass behaviour.
Structure dip and dip direction data are extracted and analysed to infer joint sets, failure mechanisms and rock mass characteristics.
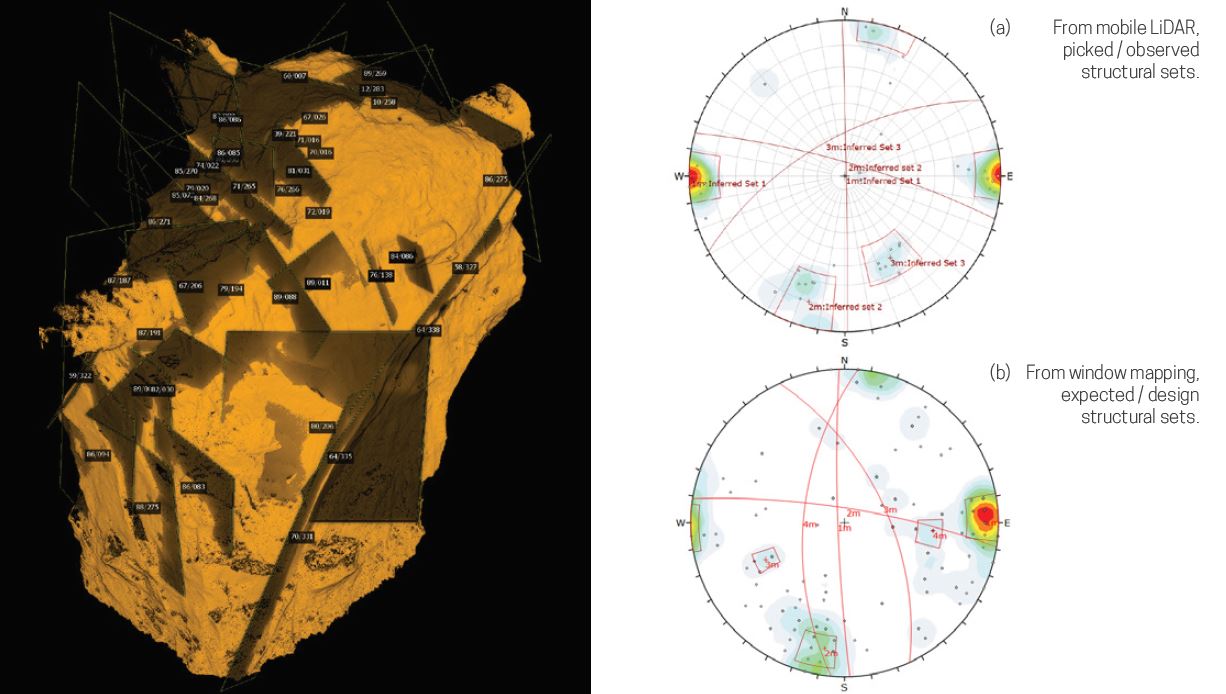
With each additional blast packet, the stope enlarges and subsequent scans track propagation along the discontinuities. Regular scanning reveals stope discontinuity behaviour, improves confidence in the modelling and uncovers potential issues. By contrast, conventional drilling and window mapping methods make discontinuity persistence difficult to verify.
To illustrate the additional detail and confidence gained from LiDAR structural characterisation, stope structures are plotted in two stereonets (Figure 14). Stereonet (a) shows discontinuities observed or traced from the high-resolution point cloud data captured by Hovermap in a final stope scan. Stereonet (b) contains the window mapping interpretation that was used for the stability analysis and design process prior to the stope’s development. The LiDAR facet picks and the window mapping for the stope’s two major sub-vertical east-west dipping structural sets present a fairly similar picture. The random sets 2 and 3 show greater variance between the expected and final observed shapes. The expected shape (b) also contains numerous randomly spaced measurements that were not observed in the mobile LiDAR data (a).
The OD geotechnical team has carried out point cloud-based analysis for entire mining blocks, such as the Limes shown in Figure 15. At this scale, it is possible to follow structural features across the mine lode. The stopes in the Limes area encounter a steeply dipping, almost vertical, north-south trending structural set. Other, smaller structures are typically east-west running.
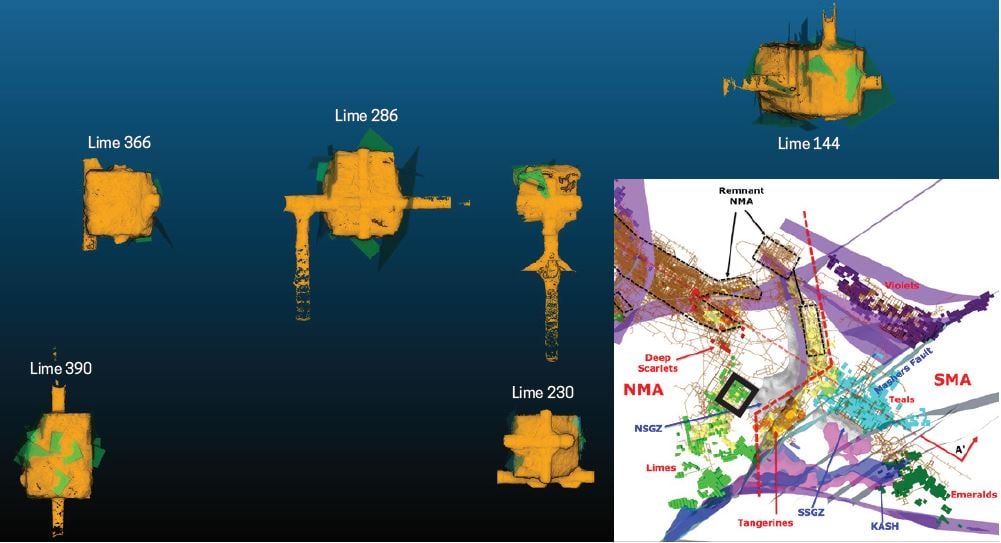
The higher level of confidence in the structural interpretation provides a basis for more detailed and consistent characterisation of the OD rock mass behavior. This enables the geotechnical team to derive richer insights into the main drivers of stability across the mining lode.
Conclusion
BHP’s adoption of mobile LiDAR technologies, such as Hovermap, has delivered numerous benefits. At OD, it is helping to de-risk the transition from the well understood NMA to the SMA, by providing unprecedented insights into the new rock mass.
Being able to safely scan previously inaccessible voids, stopes, drawpoints and orepasses allows survey, geology, engineering and geotech teams to validate and improve modelling, optimise stope design and predict stope behaviour more accurately.
OD has continued to find additional use cases for the Hovermap system and the LiDAR data it captures. Initially acquired to scan stopes, Hovermap is now used across the mine to map the ore handling system and other vertical infrastructure and identify convergence and other deformation.
Comprehensive training and regular use of the system in situ means operators are able to capture data confidently and competently via a range of methods—vehicle, tether, hand-held and drone. End users’ ability to analyse and utilize the LiDAR data has also increased significantly over time.
OD’s multi-disciplinary approach to deploying Hovermap and sharing data has encouraged collaboration across technical teams at the site and led to the development of efficient new workflows.
Hovermap is helping BHP optimise revenue at the site. Based on OD production output published by BHP in 2020 (BHP, 2020) and commodity prices (London Metal Exchange, 2020) for that year, Emesent estimates average revenue (EBITDA) per stope of US$20 million. The insights gained from data captured by Hovermap help BHP to improve confidence in the drivers of stope stability, and to develop informed responses to issues. This potentially saves the company millions of dollars each year.
References
Baylis, C & Kewe, D (2020). New technologies and methods for rock mass characterisations and domining. Presentation at East Australian Geomechanics Group, Adelaide, South Australia.
Baylis, C., Kewe, D. & Jones, E. (2020). Mobile drone LiDAR structural data collection and analysis. In J Wesseloo (ed.) Proceedings of the Second International Conference on Underground Mining Technology, pp. 325-334. Australian Centre for Geomechanics.
BHP (2020), Annual Report 2020, Retrieved from https://www.bhp.com/investor- centre/annual-report-2020/annual-report-2020/
Jones, E. (2020a). Deployment of Hovermap at Olympic Dam (webinar). Retrieved from https://www.emesent.io/resource-library/webinars/.
Jones, E. (2020b). Mobile LiDAR for underground geomechanics: learnings from the teens and directions for the twenties. In J Wesseloo (ed.), Proceedings of the Second International Conference on Underground Mining Technology, pp. 3-26, Australian Centre for Geomechanics.
Jones, E., Reardon, D. & Hrabar, S. (2019). The use of automated drones in underground hard rock mines. Proceedings Future Mining 2019, The Australasian Institute of Mining and Metallurgy, Melbourne, pp. 34–46.
Jones, E., Sofonia, J., Canales, C., Hrabar, S. & Kendoul, F. (2019). Advances and applications for automated drones in underground mining operations. In W Joughin (ed.) Proceedings of the Ninth International Conference on Deep and High Stress Mining, The Southern African Institute of Mining and Metallurgy, Johannesburg, pp. 323-334, https://doi.org/10.36487/ACG_rep/1952_24_Jones.
London Metal Exchange (2020). Retrieved from https://www.lme.com/.
Woolmer, D., Jones, E., Taylor, J., Baylis, C. & Kewe, D. (2021). Use of drone-based LiDAR technology at Olympic Dam mine and Initial technical applications. Proceedings of the Eighth International Conference & Exhibition on Mass Mining, submitted for publication.