
Spontaneous combustion of sulfide ores and concentrates – assessing the hazard likelihood
The occurrence of spontaneous oxidation and combustion of sulfide ores has been known and documented for centuries (Ninteman, 1978).
Assessing the hazard likelihood is the first step to obtaining a valid risk assessment for management planning. This requires a reliable testing procedure, which measures the self-heating behaviour that occurs when metal sulfides are exposed to air. The most common test method used for mine planning is the FR test (Moon et al, 2019). However, for shipping the common test method is the United Nations (UN) test for self-heating substances (United Nations, 2015), which includes sulfides.
Stages of sulfide self-heating
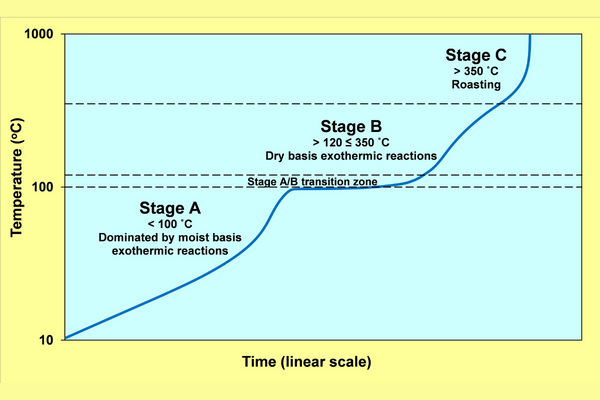
According to Rosenblum, Nesset and Spira (2001) self-heating of sulfides leading to spontaneous combustion progresses through a series of stages. These are shown schematically in Figure 1 based on more recent commercial investigations for Australian mining operations. Stage A ranges from ambient temperatures to 100˚C and is dominated by exothermic reactions that involve sulfides, air and moisture. Between 100 and 120˚C a transition zone occurs, due to moisture removal by evaporation. Subsequently, Stage B self-heating continues due to exothermic oxidation reactions in a dry state. At temperatures exceeding 350˚C sulfide roasting occurs that can lead to ignition.
Assessing spontaneous combustion hazard likelihood
Laboratory testing and classification
From a spontaneous combustion management perspective, operations need to be able to prevent the development of a heating. Therefore, hazard assessment is focused on the self-heating potential in Stages A and B. The FR test achieves this isothermally by measuring the temperature change that occurs when a sample is exposed to oxygen by a series of periodic air injections at two fixed temperatures. For Stage A testing, the sample is wetted to a moisture content of 6 per cent and allowed to equilibrate at 70˚C, before air injections are introduced lasting 15 minutes every 5 hours over a period of approximately 70 hours. The temperature of the sample is then increased to 140˚C for Stage B testing. Air injections are resumed at the same intervals, generally over a 40-hour period. Any change in sample temperature is again measured. The individual heating values for each stage are then summed to provide Stage A and Stage B self-heating capacities.
The values obtained from the FR test are then plotted on a self-heating assessment chart where Stage A values constitute the x-axis and Stage B, the y-axis. This chart is logarithmic to cover the wide range of possible values that can occur for highly reactive sulfides. There are five categories identified by the chart. These are:
- Safe
- Will not heat beyond 100˚C
- Do not expose to a high heat source
- Recommend monitoring
- Recommend preventive action.
Since the UN test is conducted isothermally at a temperature of 140˚C (Stage B only) it does not allow the development of reaction products from Stage A self-heating. This was identified as a deficiency of the test by Moon et al (2019). Consequently, it is prone to producing false negative (false pass) results and the sample is therefore incorrectly classified as safe to transport without extra precautions. It also does not take into consideration the possibility of never reaching Stage B. This situation is quantified by the FR test as Category 3.
An alternative testing and classification approach
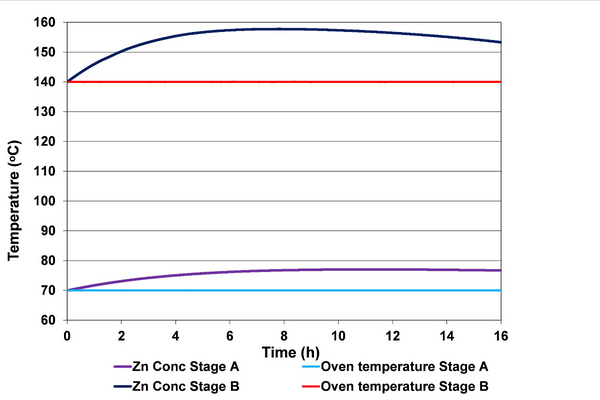
A simplified version of isothermal testing has been developed to assess Stage A and Stage B self-heating potential without multiple injections of air. This isothermal test is performed in a 500 mL double wall insulated flask, which is open to the air at the top. The flask is placed in a temperature-controlled oven that is set to 70˚C for Stage A, and the temperature change created by any oxidation reaction is recorded by a thermocouple inserted into the centre of the sample. This is recorded for a period of 16 hours. At the completion of the Stage A test, the oven temperature is increased to 140˚C and any resulting temperature increase above the oven temperature from reaction is again recorded for 16 hours.
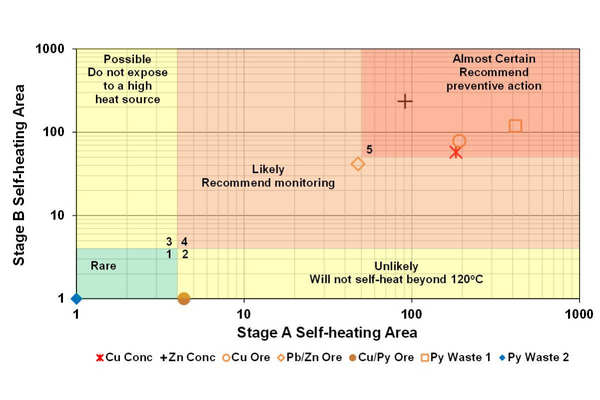
An example of the resulting Stage A and Stage B temperature curves are shown in Figure 2 for a zinc concentrate with an initial moisture content of 12 per cent. The area between the sample temperature curve and the oven temperature is a measure of the self-heating potential of the sample in each stage. These self-heating potential values can be plotted on a hazard likelihood assessment chart (Figure 3). Similar to the self-heating assessment chart used by Rosenblum, Nesset and Spira (2001), samples are separated into one of five hazard likelihood categories. These are:
- Rare
- Unlikely
- Possible
- Likely
- Almost certain.
When these are matched with the identified consequence a risk rating can be assigned and used to decide on the appropriate hazard control, if necessary, to reduce the risk.
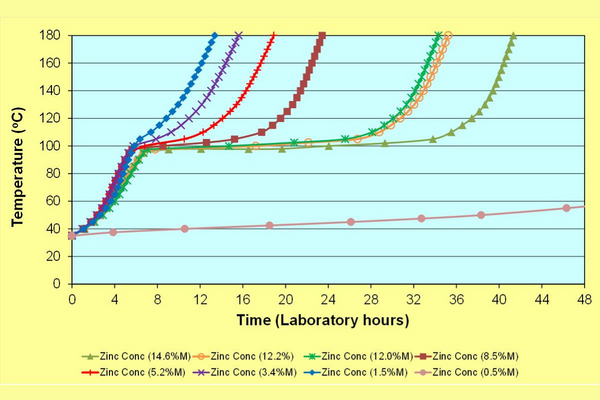
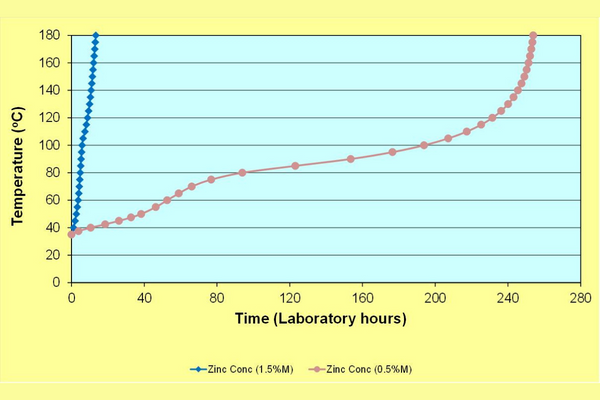
The two concentrates, copper ore and pyritic waste 1 shown in Figure 3 have a history of spontaneous combustion without using preventive action. It should also be noted that both the concentrate samples passed the UN self-heating test, which is clearly a false pass. Adiabatic Incubation testing of the zinc concentrates (Beamish and Theiler, 2019) confirms that self-heating transitions from Stage A to Stage B on the way to thermal runaway as shown in Figures 4 and 5. This occurs for concentrate moisture contents ranging from 0.5 to 14.6 per cent. At the lowest moisture content of 0.5 per cent, the timeframe is considerably longer due to limited moisture availability for reaction. At successively higher moisture contents the transition zone is prolonged due to greater evaporative heat loss.
Future improvements and opportunities
The modifications to isothermal self-heating testing of sulfide ores and concentrates presented in this article makes it possible to accommodate batch testing of multiple samples to produce cost effective and reliable spontaneous combustion hazard likelihood assessment results. These results are calibrated against the known self-heating behaviour of benchmark samples, obtained from laboratory Incubation testing and site experience. The likelihood rating can then be incorporated into a formal risk assessment to ensure appropriate hazard management plans are developed for mining, handling, processing, storage and transport. There is also an opportunity to conduct further research on the effectiveness of control measures to mitigate the development of unwanted heating events.
Please note: Bulletin articles are general in nature and not peer reviewed.
References
Beamish, B B and Theiler, J, 2019. Coal spontaneous combustion: Examples of the coal self-heating incubation process, International Journal of Coal Geology, 215, 103297.
Moon, S, Rosenblum, F, Tan, Y H, Nesset J E, Kristian, Waters, K E and Finch, J A, 2019. Examination of the United Nations self-heating test for sulphides, Canadian Metallurgical Quarterly, https://doi.org/10.1080/00084433.2019.1617498.
Ninteman, D J, 1978. Spontaneous oxidation and combustion of sulfide ores in underground mines, US Bureau of Mines Information Circular 8775.
Rosenblum, F, Nesset, J and Spira, P, 2001. Evaluation and control of self-heating in sulphide concentrates, CIM Bulletin, 94 (1056):92-99.
United Nations, 2105. Manual of tests and criteria for self-heating substances (Part III, Classification procedures, test methods and criteria relating to Class 3, Class 4, Division 5.1 and Class 9); 357–359.